

How to Read Crypto Bollinger Bands
Bollinger Bands help you spot changes in volatility, figure out whether Bitcoin or another cryptocurrency is trading at a relatively high or low price, and identify potential breakouts or reversals.
But reading Bollinger Bands isn't as simple as buying when the price hits the lower line and selling when it reaches the upper one. Crypto markets can trend strongly for days or weeks, and prices can keep moving outside the bands for longer than you might expect.
The trick is understanding what the bands tell you about market conditions and combining them with other indicators to confirm what the price might do next. Our guide covers how crypto Bollinger Bands work, how to read their different patterns, and how to use them alongside other technical indicators.
What are crypto Bollinger Bands?
Bollinger Bands are a technical analysis indicator developed by John Bollinger in the 1980s. They're used to measure market volatility and show how a cryptocurrency's current price compares with its recent price action.
The indicator consists of three lines plotted over a price chart: a middle moving average, an upper band, and a lower band. The distance between the outer bands changes with volatility, making it easier to spot when a market is relatively quiet or experiencing larger price swings.
Bollinger Bands are available on most crypto charting platforms, including TradingView, and are available for most major cryptocurrencies.
How do crypto Bollinger Bands work?
Bollinger Bands use a moving average and standard deviation to create a dynamic price envelope around a cryptocurrency's recent price.
The standard settings use a 20-period simple moving average (SMA), and bands positioned two standard deviations above and below that average. A period refers to one candle on your chart, so 20 periods could mean 20 hours on an hourly chart or 20 days on a daily chart.
The three lines are calculated as follows:
Middle band: The 20-period simple moving average.
Upper band: The middle band plus two standard deviations.
Lower band: The middle band minus two standard deviations.
Standard deviation measures how much prices vary from their average. When price movements become larger, standard deviation tends to increase, and the bands spread apart. When prices settle into a quieter range, standard deviation falls, and the bands move closer together.
This makes Bollinger Bands useful for identifying changes in volatility without relying on a fixed price range.
What do Bollinger Bands measure?
Bollinger Bands measure relative price levels and volatility. They don't tell you whether a cryptocurrency is fundamentally overvalued, nor can they predict the direction of the next price move.
For example, if Bitcoin trades near its upper band, it means its price is relatively high compared with its recent history. That can indicate strong upward momentum, a market that's stretched to the upside, or both.
Likewise, a price near the lower band may indicate selling pressure or a potential rebound, depending on the broader trend.
Bollinger Bands are most useful when you look at the relationship between price, the middle band, and the width of the outer bands rather than treating each line as a fixed support or resistance level.
Are Bollinger Bands useful for crypto?
Yes. Bollinger Bands can be useful for crypto trading because the markets are volatile. Unlike fixed-price support and resistance levels, Bollinger Bands adapt to recent price movements. There are several ways traders use them:
Measuring volatility: Widening bands indicate increasing price variation, while narrowing bands indicate lower volatility.
Spotting potential breakouts: A period of tight bands can precede a larger price move.
Assessing momentum: Repeated moves along the upper or lower band can help identify a strong trend.
Identifying possible reversals: In ranging markets, a move towards an outer band followed by a rejection can suggest that price may return towards the middle band.
Finding potential entry and exit points: Traders may use the bands to identify areas worth watching, then seek confirmation from price action or another indicator.
However, Bollinger Bands have limitations. A narrow range doesn't tell you whether the next breakout will be bullish or bearish, and a price touching the upper band doesn't automatically mean a reversal is coming. Bollinger Bands are best treated as one tool in understanding crypto price movements and market trends.
How to read Bollinger Bands for crypto?
To read Bollinger Bands, start by looking at three things: where the price sits relative to the bands, how the bands are shaped, and whether the market is trending or moving sideways.
1. Understand the upper, middle, and lower bands
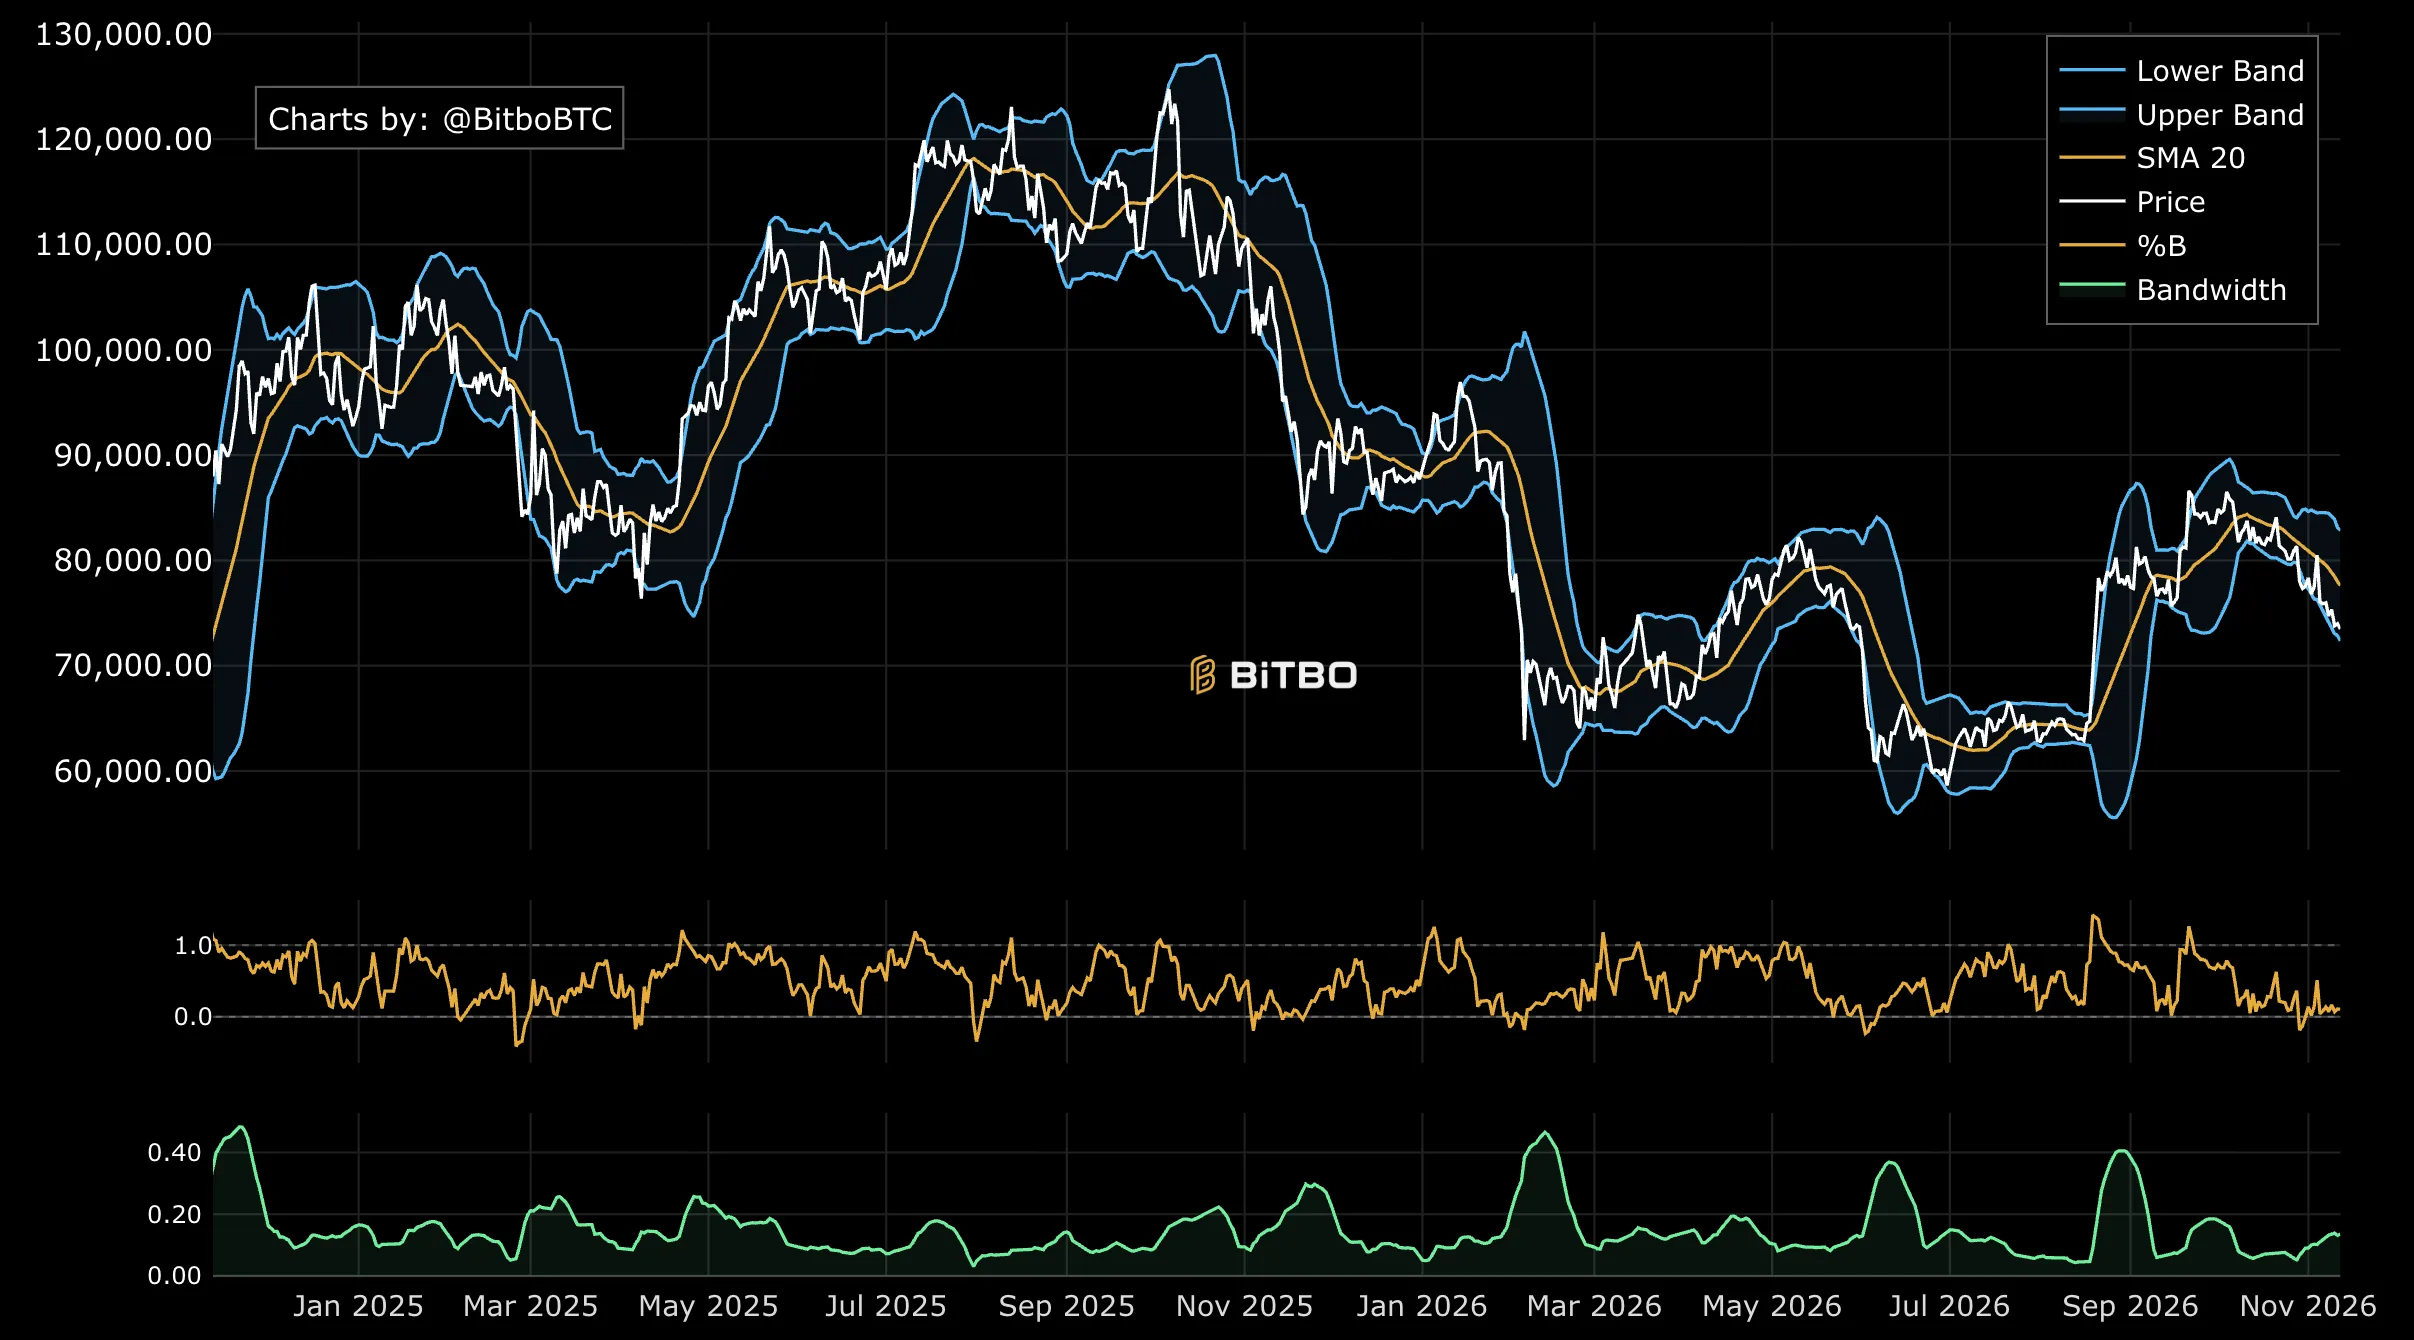
Each of the three bands has a different role.
The upper band shows where the price sits relative to the upper end of its recent range of variation. When price approaches or moves above it, the market is trading relatively high compared with its recent history. In a strong uptrend, this can reflect buying pressure rather than an imminent reversal.
The middle band is usually a 20-period SMA. It provides a reference point for the recent average price and can help traders assess the direction of the short- to medium-term trend. Price holding above a rising middle band may support a bullish interpretation, while price staying below a falling middle band may suggest bearish momentum.
The lower band marks the lower end of the indicator's dynamic price envelope. A move towards it can indicate selling pressure, but it doesn't automatically mean Bitcoin or another cryptocurrency is oversold enough to rebound.
As a starting point, look at where price is closing relative to the three lines. A single candle touching a band is less informative than a sequence of candles showing how price behaves around it.
2. Read the width of the bands
The distance between the upper and lower bands tells you about recent volatility.
When the bands widen, price movements have generally become larger. This often happens during a strong rally, a sell-off, or a period of increased uncertainty.
Meanwhile, when the bands narrow, price movements have generally become smaller. This can happen while a cryptocurrency consolidates within a tight range.
Neither condition tells you the direction of the next move. Widening bands can accompany a rally or a crash, while narrowing bands can persist longer than expected.
3. Identify a Bollinger Band squeeze
A Bollinger Band squeeze occurs when the bands contract significantly, indicating a period of relatively low volatility.
This often happens when the price trades sideways within a narrow range. Traders watch for squeezes because periods of low volatility can be followed by periods of higher volatility.
However, a squeeze doesn't predict whether the breakout will be bullish or bearish.
For example, imagine Bitcoin trades between $60,000 and $61,000 for several days. The bands gradually tighten as the price range contracts. If Bitcoin then breaks above the consolidation range with strong volume and holds above the upper band, traders may interpret that as a potential bullish breakout.
If it instead breaks below support and moves beneath the lower band, the setup may point to a bearish move. Neither outcome is guaranteed. False breakouts can occur, and price may quickly return to its previous range.
Some traders use Bollinger BandWidth, a related indicator that quantifies the distance between the bands, to identify unusually tight squeezes. Comparing BandWidth with its own historical readings can help make the pattern easier to spot.
4. Look for breakouts above or below the bands
A breakout occurs when price moves beyond the upper or lower Bollinger Band.
A close above the upper band can indicate strong upward momentum, while a close below the lower band can indicate strong downward momentum. In the right conditions, these moves may mark the start or continuation of a trend.
To assess a breakout, traders often look at:
Volume: Is trading activity increasing alongside the move?
Trend direction: Does the breakout align with the broader market trend?
Follow-through: Does price continue beyond the band, or quickly move back inside?
Support and resistance: Has price broken an important level, or is it moving into an area where sellers or buyers may step in?
A breakout that quickly reverses can be a false signal. Waiting for confirmation may reduce some false entries, although it can also mean entering later if the move continues.
5. Understand when price walks the bands
When price repeatedly touches or moves beyond one of the outer bands, this is known as ‘walking the bands’.
During a strong uptrend, candles may repeatedly reach the upper band as buying pressure pushes prices higher. In a strong downtrend, price may keep touching the lower band as selling pressure persists.
This matters because traders sometimes assume that an upper-band touch means the market is overbought and due for a fall. But in a strong trend, selling simply because price reaches the upper band can mean trading against the momentum.
Instead, look at the middle band and the wider price structure. If the middle band is rising and price repeatedly finds support around it, the uptrend may still be intact. If the middle band is falling and price keeps struggling to recover above it, the downtrend may remain strong.
Walking the bands doesn't mean a trend will continue indefinitely. It means that repeated outer-band touches should be interpreted in the context of the trend rather than as standalone reversal signals.
6. Read Bollinger Bands in a sideways market
Bollinger Bands can be particularly useful when a cryptocurrency trades within a clear range rather than trending strongly.
In a ranging market, price may move between the upper and lower bands, with the middle band acting as a reference point for the average price.
Some traders look for potential buying opportunities near the lower band and selling opportunities near the upper band, particularly when the price shows signs of rejecting either extreme.
For example, if Ethereum repeatedly rebounds from the lower band and returns towards the middle band, a trader might watch for another rebound when price approaches the lower band again.
But the strategy depends on the range holding. If Ethereum breaks below support and starts trending down, the lower band may no longer act as a useful reversal area.
7. Watch for the middle-band crossover
The middle band can help traders assess whether price momentum is changing.
If price moves from below the middle band to above it, that may suggest improving momentum. If it falls from above the middle band to below it, that may suggest weakening momentum.
The signal is more useful when combined with the direction of the middle band and the wider market structure.
For example, a move above a rising middle band during an established uptrend may support a bullish continuation setup. A move above a falling middle band during a downtrend could be only a temporary rebound.
A crossover alone doesn't confirm a trend reversal. Consider whether price is breaking a significant resistance or support level and whether other indicators support the move.
8. Look for failed breakouts and reversals
Not every move outside the bands develops into a sustained trend.
If price closes above the upper band but quickly falls back inside, the breakout may be losing strength. Similarly, a move below the lower band followed by a rapid recovery may suggest that selling pressure is easing.
Traders may look for additional confirmation, such as a momentum divergence, a change in volume, or a break of a short-term trendline.
One pattern associated with Bollinger Bands is the W-bottom. In a potential bullish reversal, price makes an initial low near or below the lower band, rebounds, then retests the low area without reaching the lower band again. A subsequent move above an intermediate resistance level may strengthen the bullish interpretation.
9. Use the timeframe to add context
Many traders use a higher timeframe to establish the broader trend and a lower timeframe to look for potential entries. Bollinger Bands can be applied to short-term, hourly, daily, or weekly crypto charts. The timeframe changes what the indicator tells you.
On a 15-minute chart, the bands respond to relatively short-term price movements and may produce frequent signals. On a daily chart, they reflect a longer period of price behaviour and can help put short-term volatility into context.
A setup on a short timeframe may conflict with the broader trend. For example, Bitcoin might break above the upper band on a 15-minute chart while remaining below a falling middle band on the daily chart.
10. Choose the right Bollinger Band settings
The standard Bollinger Band settings are a 20-period SMA with bands set two standard deviations above and below it. These settings are a starting point rather than a universal rule.
A shorter period makes the bands more responsive to recent price changes, but it can also produce more frequent signals. A longer period smooths the indicator and may be more useful for analysing broader trends, although it can react more slowly to new movements.
Changing the standard deviation multiplier also affects the width of the bands. A lower multiplier brings the bands closer to the middle line, so price will touch or cross them more often. A higher multiplier creates wider bands, so outside-band moves may be less frequent.
If you adjust the settings, test them against historical data and consider how they perform across different market conditions. Avoid changing the parameters simply to make past trades look better.


